Image processing(放大缩小)
放大缩小
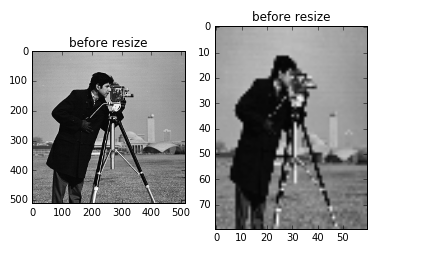
OpenCV: cv2.resize() 可以通过指定目标图像的大小来进行图像的放大和缩小。
上课方法:
img1 = cv2.imread("ch.jpg",-1)
# 获取行跟列,长跟宽
h,w = img1.shape[:2]
print(h*3,w*2.8)
# 1:1
out = cv2.resize(img1,(w,h))
# resize()
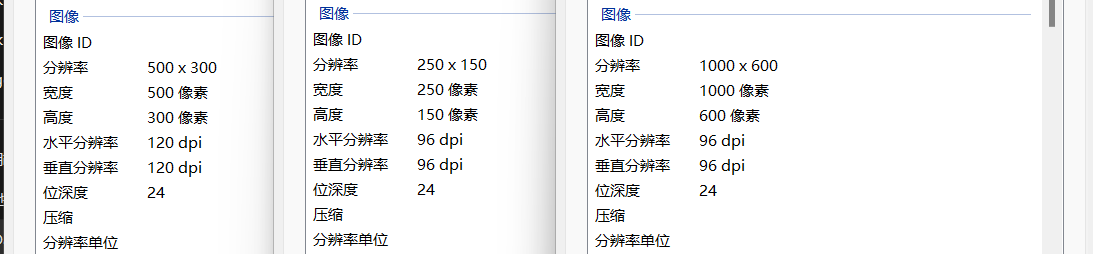
# 指定宽高像素
out = cv2.resize(img1,(24,50))
# 按比例(整数)
out = cv2.resize(img1,(2*w,2*h))
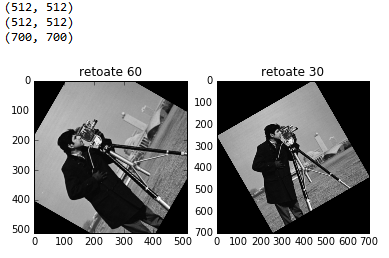
print(out.shape[:2])
# 按比例(小数)强制类型转换
out = cv2.resize(img1,(int(2.5*w),2*h))
print(out.shape[:2])
# 按倍数放大,倍数是小数
out = cv2.resize(img1,None,fx=2.8,fy=3)
print(out.shape[:2])
cv2.imwrite("out.jpg",out)
补充方法:
PIL/Pillow: Image.resize() 方法也可以用于图像的调整大小。
from PIL import Image

img = Image.open('r-c.jpg')

# 图像放大到原始图像的两倍
img_resized_big = img.resize((img.width*2,img.height*2))

# # 图像缩小到原始大小的一般
img_resized_small = img.resize((img.width//2,img.height//2))

img_resized_big.save('r-c-resized-big.jpg')
img_resized_small.save('r-c-resized-small.jpg')
scipy: scipy.ndimage.zoom() 函数可以进行图像的缩放。
原理: 通过将输入的图片从一个颜色域转换到另一个
设原图
目标图片
设 size 之比为,则:
设原图坐标上的像素点 ,
目标图片坐标上的像素点为
最近邻插值算法(当参数order=0时)
- 目标图片的坐标点,对应原图哪个坐标点,公式:
- 根据 的值四舍五入为整数,填充到目标图片的相应位置
通过实验可以看到,经过转换后的图片出现了锯齿感
eg.
n1 = np.array([
	[1,2],
	[3,4]
])

n1 = ndimage.zoom(n1, 2, order = 0)
"""
[[1 1 2 2]
 [1 1 2 2]
 [3 3 4 4]
 [3 3 4 4]]
"""
双线性插值算法(当参数order=1时)
- 计算目标图片的坐标点对应原图中哪个坐标点(此步与最邻近插值算法相同)
- 由于点 是个浮点数坐标,无法用整型的灰度值或RGB值来表示,因此双线性插值算法通过寻找距离这个对应坐标最近的四个像素点,来计算该点的值(灰度值或RGB值) 设分解后的坐标为:
首先,在x方向上进行线性插值, 代表该点的像素值
然后,在 y 方向上进行线性插值:
得到的 就是该点经过处理后的像素值,填充到目标图片的相应位置
通过实验观察,双线性插值算法的锯齿感要少于最邻近插值法
n1 = np.array([
	[1,2,3],
	[4,5,6],
	[7,8,9]
])

n1 = ndimage.zoom(n1, 2, order = 1)
"""
[[1 1 2 2 3 3]
 [2 3 3 3 4 4]
 [3 4 4 5 5 5]
 [5 5 5 6 6 7]
 [6 6 7 7 7 8]
 [7 7 8 8 9 9]
]
"""
其中需要注意在 zoom() 函数中,当对彩色图像进行缩放时,默认情况下会对每个通道进行相同的缩放操作,从而导致输出的图像形状变为 (height, width, channels * 缩放因子)。
要解决这个问题,您可以分别对每个颜色通道进行缩放,然后重新组合它们,使得输出的图像形状与预期相符。
代码:
import numpy as np
import matplotlib.pyplot as plt
from scipy.ndimage import zoom
from PIL import Image

img = np.array(Image.open('r-c.jpg'))

# 使用zoom()函数对图像进行放大缩小
# zoom(输入图像数组, 缩放因子, 输出形状, order=1)
# order参数指定插值方法,默认为3,即双三次插值。这里设置为1,使用双线性插值。

# 分别对每个通道进行缩放
channel_r = zoom(img[:,:,0], 2, order=1)
channel_g = zoom(img[:,:,1], 2, order=1)
channel_b = zoom(img[:,:,2], 2, order=1)

# 重新组合通道
img_zoomed = np.stack((channel_r, channel_g, channel_b), axis=-1)

plt.imshow(img_zoomed)
plt.axis('off')
plt.show()
skimage: scikit-image 库中提供了一些函数,如 skimage.transform.rescale() 和 skimage.transform.resize(),可以实现图像的缩放。
skimage在读使用io.imread读取灰度图像时(as_grey=True / as_gray=True)会做归一化处理数据类型转化为float64;
主要在resize方面,cv2.resize就是单纯调整尺寸,而skimage.transform.resize会顺便把图片的像素归一化缩放到(0,1)区间内;
改变图片尺寸 skimage.transform.resize(image, output_shape)
按比例缩放 skimage.transform.rescale(image, scale[, ...]) scale参数可以是单个float数,表示缩放的倍数,也可以是一个float型的tuple,如[0.2,0.5],表示将行列数分开进行缩放
旋转 skimage.transform.rotate(image, angle[, ...],resize=False)
同样的在 skimage 的 transform.rescale() 函数中,默认情况下会对图像的每个颜色通道进行相同的缩放操作,导致输出的图像形状为 (height, width, channels * scale_factor)。
为了解决这个问题,您可以按照以下步骤分别对每个颜色通道进行缩放,然后重新组合它们以获得正确的图像形状
代码:
import matplotlib.pyplot as plt
from skimage import io, transform
import numpy as np

img = io.imread('r-c.jpg')

# 分别对每个通道进行缩放
channel_r = transform.rescale(img[:,:,0], scale=2, anti_aliasing=True)
channel_g = transform.rescale(img[:,:,1], scale=2, anti_aliasing=True)
channel_b = transform.rescale(img[:,:,2], scale=2, anti_aliasing=True)

# 重新组合通道
img_zoomed = (channel_r[..., np.newaxis], channel_g[..., np.newaxis], channel_b[..., np.newaxis])
img_zoomed = np.concatenate(img_zoomed, axis=-1)

plt.imshow(img_zoomed)
plt.axis("off")
plt.show()